


Talk about famous last words. When we last left this topic, I was wrapping up coffee with my colleague, Rick, with the ominous, “Once we get your data organized …”
It’s a good thing we had fueled up on coffee because, even with a 24 x 7 or so work cycle between our US and India analytic teams, managed markets data are downright dirty. The problems came at us from all sides:
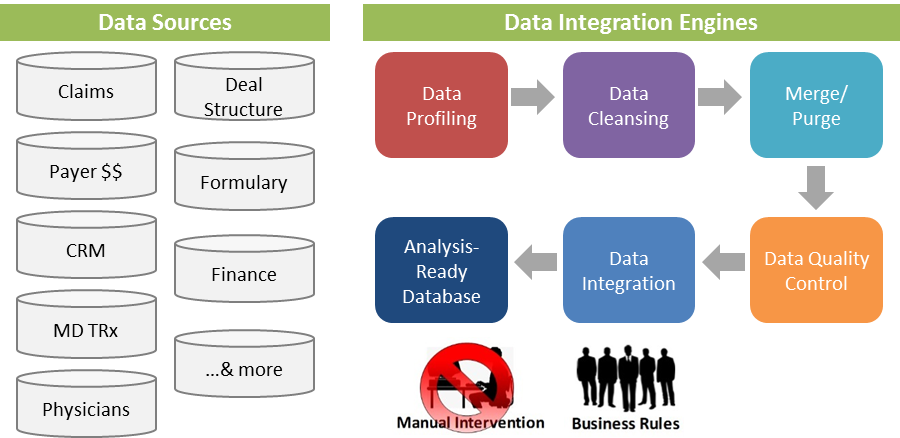
- While there are numerous third party data sources that, taken individually, add clarity to understanding the market, there are many obstacles to building bridges and integration rules across these data sets:
- Lack of uniform naming conventions and plan identifiers
- Incomplete definition of parent-child relationships across different organizations
- Differing data lags, coverage gaps and/or data masking
- Multiple definition and coding schemes to define formulary status
- Internally, Rick and his team did not have a well-kept historical record of:
- The structure of existing and prior contracts (e.g., what ‘levers’ did they contract to get ‘pulled’ by the payer and what did they offer in return)
- Deal/contract objectives (e.g., what outcome did they anticipate by getting a certain formulary position, co-pay, etc.)
- Historic promotional activity - what were the plans across all selling teams to pull through the contract? Did they execute as planned?
- Historic contract performance measurement
- And, the processes that did exist to integrate these data were often ad-hoc in nature, with little documentation and much of the knowledge locked in the heads of the few staff members responsible for running the operation.
Before Rick, the team and I dove into these deep waters, we took a few deep breaths and laid out some guiding ‘principles’ for how we’d break down this large problem, solve the right components first and build it back up to a sustainable ongoing solution:
- Think “crawl-walk-run”: as part of our initial assessment, we encouraged the team to concentrate on identifying the relatively straightforward actions that we could take with confidence that would also have the biggest payoff. This necessarily meant we were going to push some ‘harder’ items down the priority list, but we felt it was more important to execute with confidence and deliver successfully on some things than to try to tackle all things.
- Lay out a “journey” for the field team so that they could see what they would get first (e.g., crawling), where we’d need their help to go to the next level of complexity (e.g., walking) and what vision we were shooting for (e.g., running). Beyond getting buy-in and some measure of excitement from the field up-front, this approach also helped us to anticipate the next steps to move more quickly from crawling to walking to running.
Our “crawl” (that was even the official name of the project phase on our Gannt charts) began with the seemingly gargantuan task of building the processes, tools and operations to integrate the data, reliably and repeatedly. Long days and late nights ensued. Many cups of coffee were consumed, unfortunately not in the “third space” of some hip espresso bar, but in the basement rabbit warren of the office where IT, analytics and operations teams often seem to get put.
Grumpy analysts changed the first phase name from “Crawl” to “Slog.”
But, nothing motivates a team like a deadline and the next sales meeting loomed large on the calendar. The team’s collective meticulous attention paid to documentation, development of data dictionaries & business rules, and the implementation of robust data integration engines eventually paid off as we were able to deliver repeatable data management/governance processes and analysis-ready databases … 
… that fed user-friendly reports to the Key Account Manager’s (KAMs) iPads:
 For the first time in his career, Rick got high-fives from the KAMs and the franchise leaders for rolling out a new reporting system to a sales force. Everyone loved their shiny new iPads and user-friendly, swipe-, zoom- and drill-enabled reports.
As proud as we were of what we had accomplished, we knew we were still just crawling (well, maybe, we were upright and at a very slow walk). We knew the euphoria would be short-lived: as with account-based selling across multiple industries, the secondary data, even when cleaned and well-integrated, failed to capture all of the nuances and fields of information needed to optimally manage the accounts.
Fortunately, we had already mapped out the next phase of the project (“Walk This Way”): turning the KAMs’ new toys (iPads) into a well-structured and focused tool to capture targeted field intelligence from the KAMs, such as …
- Relative influence of decision makers, contracting process, complexity, etc.
- Affiliations across multiple levels (e.g., physician-plan, physician-hospital, IDNs, etc.)
- Therapeutic area priorities by accounts
- More detail and specificity on formulary control mechanisms
… so that we could transform anecdotal knowledge trapped in individual KAMs' heads to a corporate asset, an Account Profile Master database. While we never marketed it this way to the KAMs, our goal was to create a user-friendly app that would deceptively suck years and decades of accumulated wisdom from the KAMs’ minds: we wanted to tap right into and extract (painlessly) the KAM Braintrust.
Having already “won over” the field with a sleek reporting engine, the pilot of the Account Profiling tool (which linked seamlessly to their existing CRM) with a subset of KAMs went smoothly. By incorporating the pilot team’s feedback, Rick and the team were able to rollout not only the updated Account Profiling tool, but a fully-integrated process that had end-to-end integration of the secondary data with the ‘KAM Braintrust’ (e.g., the Corporate Account Profile Master): 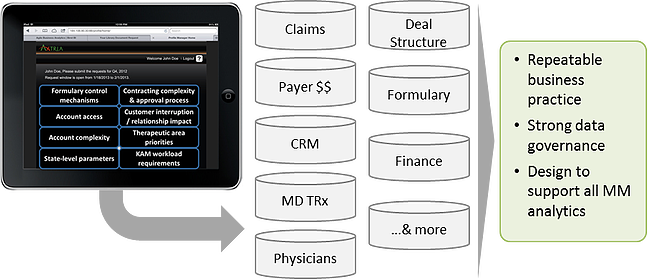 And with this successful rollout, Rick replaced the team’s office coffee with a more celebratory beverage so we could reflect on what they had accomplished:
- Transformed an ad-hoc, poorly documented, people-intensive data mess into an automated, tool- and parameter-driven data integration operation
- Brought the field from a mish-mash of cumbersome and bloated spreadsheets to a sleek, user-friendly iPad reporting app that delivered insight at the point of need (Get our whitepaper - Better Reporting with iPad)
- Laid the foundation for the business to move from being ‘managed by anecdotes’ to being ‘guided by the data’
- Accomplishing this with a steady stream of interim “wins” through their crawl-walk-run approach
The team certainly earned a few days of relaxation … but only a few days, because, with the power of such data at the fingertips of the organization, Rick knew the business questions for even deeper-dives and more analytics would start coming from all sides.
Coming up next to conclude this blog series – Running an MMA Marathon