


Situation
Client, a leading brand from a top healthcare and medical products company, wanted to establish an optimum marketing mix model and calculate the ROI for marketing activities.
- Detailing
- Digital
- Television
- Radio
- National/Regional Publications
- Out of Home media
Challenges
- The marketing spend data was non-granular, monthly spends for the channels were most at city level, with spends for some channels like Television at national level
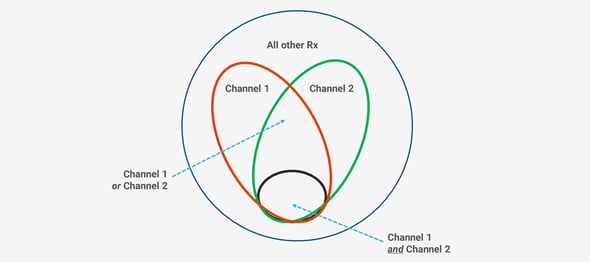
- Multiple overlapping channels were employed simultaneously
- To account for unequal sizes of ZIP codes, there was need for data normalization to provide an unbiased estimate of effectiveness
- Client further wanted to estimate impact/effectiveness of publications in different cities/markets
Approach
Axtria built a robust Market Mix Model to estimate the impact/effectiveness of individual channels. In order to tackle above challenges, Axtria undertook a stepwise approach:
- Employed US Census Bureau data to estimate ‘localized’ spending of each channel from the non-granular city level monthly spend data
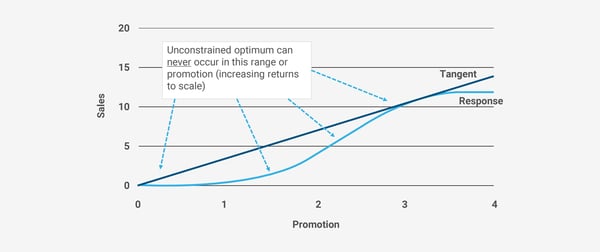
- Estimated response curves, which is the foundation for measuring effectiveness and making resource allocation decisions. Shapes of response curve can vary by channels, products and segments.
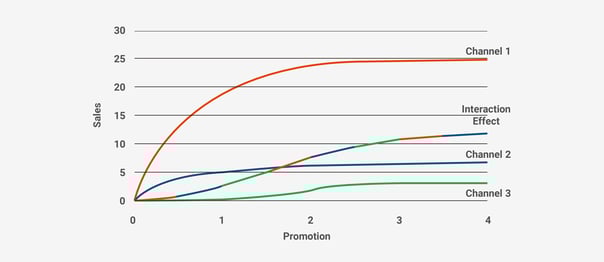
- To accurately capture the on-ground reality, response models that allow threshold effects were used. For example sigmoidal curves (S-shaped) were used to model threshold effects for some channels.
- Multi-channel effects (multiple promotion streams aimed at the same target) were captured in multiple response curves that include a specific “interaction” component.
- After computing ‘localized’ spending of each channel, normalization was done to transform all metrics to ensure that they were not biased by the size of ZIP. For example Sales metric was replaced by market share; ZIP spending was replaced by ZIP spending per target and so on.
- Publications were categorized into buckets based on characteristics of target population and then impact of each category was evaluated in different markets.
Result
- Axtria’s marketing mix allocation strategy helped the client in reducing total spend by 10% and at the same time increasing market share by 2% within an year
- Axtria helped the client in developing a semi-automated marketing mix tool which is being used by client in-house.
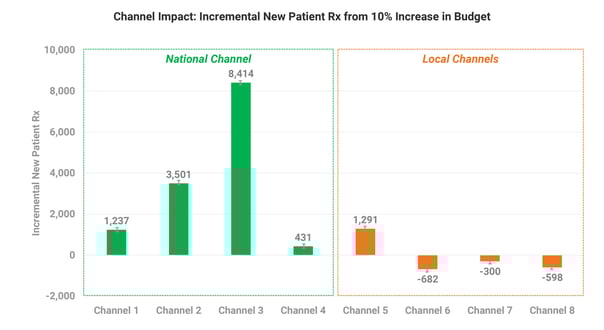
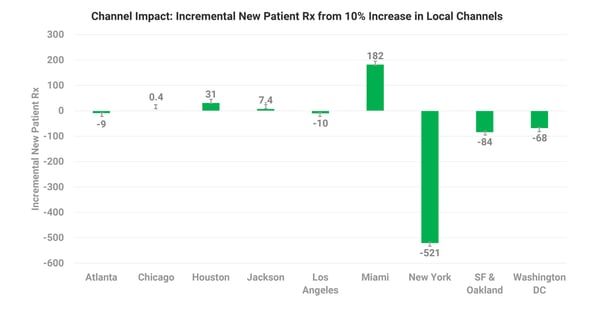
Below are a couple of screenshots from the effectiveness study:

Complete the brief form to download the white paper