Promotional blackouts, defined as strategically timed periods during which marketing promotions are intentionally withheld, have emerged as a noteworthy component of contemporary marketing strategies. This blog delves into the role of promotional blackouts, examining their impact on consumer behavior, brand perception, and overall marketing effectiveness. The blog touches upon the diverse motivations behind adopting promotional blackouts, from creating a sense of urgency and exclusivity to mitigating consumer fatigue. However, at the core, this blog will explore the nuanced relationship between promotional blackouts and baseline sales. It will investigate the extent to which these intentional breaks impact the long-term and non-promotional performance of drugs.
What is a Promotional Blackout?
A promotional blackout is a deliberate and complete cessation of promotional activities, such as field force promotions and speaker programs. A promotional blackout usually happens around a significant event, such as when the drug approaches its loss of exclusivity (LOE) date or when sales remain flat for a sustained period. While it might seem paradoxical to halt efforts designed to drive sales and revenue, the blackout can yield various benefits when employed strategically. There are two main objectives that companies try to achieve through promotional blackouts:
- Budget optimization: Companies dealing with matured brands for which sales have plateaued can use promotional blackouts to redirect funds towards more profitable brands.
- Long-term strategy: A promotional blackout of specific channels can establish a unique identity, setting the business apart from competitors and encouraging innovation and adaptability.
Despite their intended objectives, some of the potential impacts and considerations of promotional blackouts include:
- Competitor dynamics: A blackout could provide competitors an edge if they continue promotions during this period.
- Revenue reduction: It is undeniable that a promotional blackout might lead to a decrease in revenue. But most importantly, brand loyalty would start declining. In other words, baseline sales would begin eroding.
What Does Baseline Erosion Mean?
Baseline erosion refers to the gradual decline in a brand’s loyalty over time. There may be multiple explanations for the fall. One prominent reason is when customers, healthcare physicians (HCPs), or patients are not exposed to any promotional activity due to blackout, which increases hesitancy to prescribe or adopt the drug as usual.
How Do We Measure Baseline Erosion?
While there are multiple approaches to measuring the rate of baseline sales erosion, in this blog, we will limit the discussion to the following two methods:
- Marketing mix model parameters-based calculation.
- HCP-level patient retention rate-based estimation.
1. Marketing mix model parameters-based calculation: This approach leverages different marketing mix (MMx) model parameters to estimate the decay in baseline sales. Generally, three components in the model contribute to total sales:
- Brand equity
- Sales carryover
- Impactable sales (those attributed to promotions)
Sales generated through brand equity and sales carryover are considered baseline sales. Once promotions have stopped, those are the only components expected to generate sales; the impactable sales component ceases to exist. The estimated sales generated in the post-blackout period can be derived as a function of sales carryover coefficients (calculated through MMx analyses):
Current Month Sales = [One-month-prior sales * One-month-prior coefficient] +
[Two-month-prior sales * Two-month-prior coefficient]
The figure below illustrates the broader steps that this approach takes to estimate the projected baseline sales once all promotions stop.
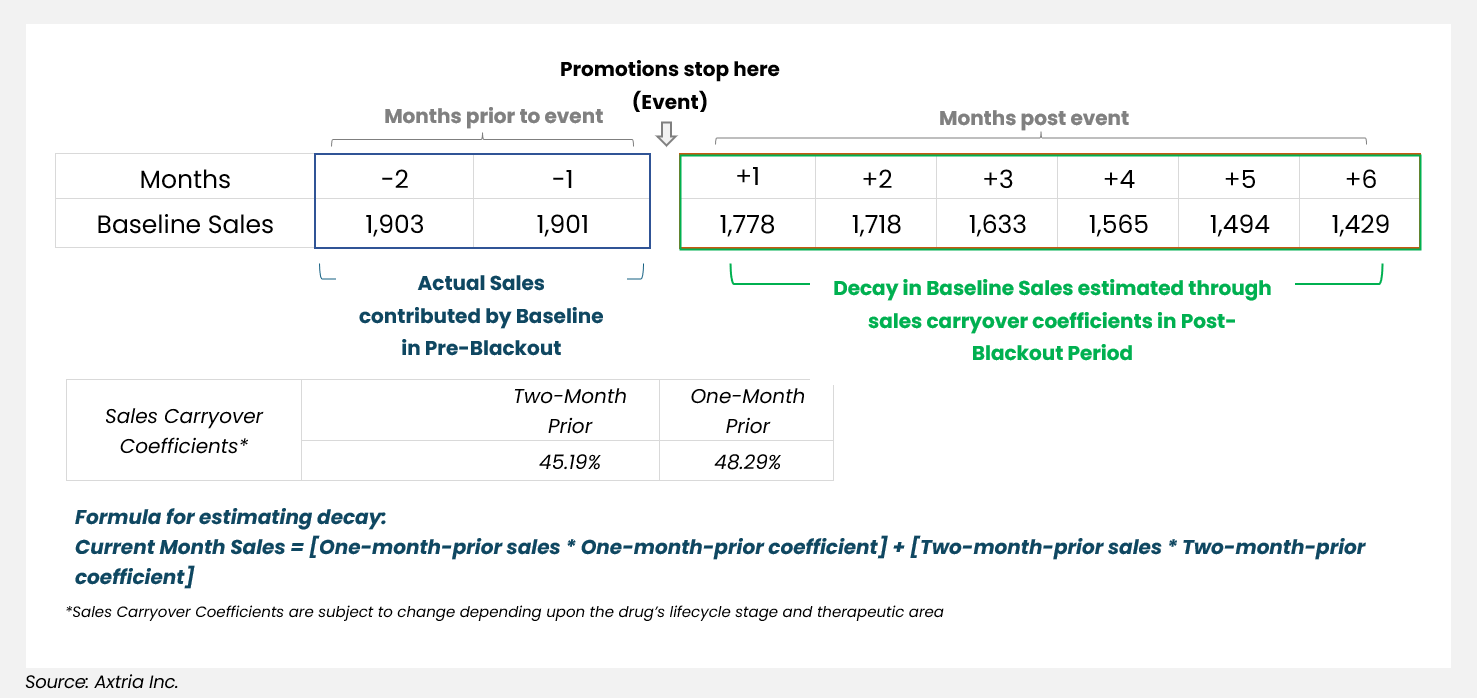
Figure 1: Estimating decay of baseline sales
At a broad level, this approach is more of a back-of-the-envelope calculation, as it assumes that sales generated at any point once the promotions go dark is just a function of carryover sales coefficients and hence is an inward-looking approach to estimate decay in future sales.
There are limitations to this approach:
- It relies exclusively on the sales lag coefficients of previous months to project future baseline sales. The drawback is that sales lag coefficients are solely influenced by historical sales data, which are unaffected by promotional blackouts.
- Additionally, the approach does not capture the actual change in drug sales dynamics, which would be much more closely captured in the shift in new initiations (new prescriptions, or NRx) or the continuing patients (repeat prescriptions, or RRx).
- Lastly, it overlooks marketplace realities like competitor behavior, new launches, and HCP loyalty to the brand.
2. HCP-level patient retention rate-based calculation: Aside from marketing efforts, several factors can influence the sales decay rate once promotional activity goes completely dark. For example, marketplace conditions or competitor behavior can affect HCP-patient retention rate and physician loyalty to the brand. Therefore, a suitable approach should be based on more than just prior months’ sales carryover coefficients. Assessing the patient churn at an HCP level will give us all the parameters to estimate the decay rate for each HCP or HCP segment.
The crux of this approach is to compare the change in behavior of a small group of HCPs (the test group) between pre- versus post-blackout periods. We do this by measuring the number of patients they initiate or maintain on the therapy during those periods. We then overlay the retention rate for new and continuing patients onto a broader pool of HCPs (the control group).
There are five steps when outlining an HCP-level patient retention rate-based calculation:
Step 1: HCP Test and Control Group Identification: Since the promotional blackout has not taken effect, the obvious question is how we identify HCPs for the test group. To do that, we must find HCPs who had been on the marketing target list for the drug and subsequently removed. This situation is similar to a promotional blackout for the broader HCP pool.
- The test group must meet the following three criteria:
- HCPs who were exposed to some promotions in the past (at least six months of promotional exposure in the pre-blackout period), but the promotion stopped at a certain point (referred to as the “blackout event” throughout this blog),
- HCPs who had some prescription history in the pre-event period (before the promotion was stopped),
- HCPs with no promotion exposure in the post-blackout period for at least 12 months.
Note that the start of the blackout period for each HCP could be different. We need to ensure that every HCP in the test group has exposure to promotions until a certain point. Additionally, for each HCP in the test group, we need to ensure that we have at least 18 months of data, including at least six months when the HCP was exposed to promotional tactics and 12 months of data when the HCP has absolutely no exposure to promotional tactics.
- Create a control group of HCPs comprising everyone in the most recent MMx analysis universe:
- HCPs who were targeted through promotional activity in the last 12 months,
- HCPs with a prescription history in the latest 12 months,
- HCPs who are part of the analysis universe of the latest MMx model.
Step 2: Retention Rate Calculation: Among the HCPs in the test group, we look for patient-related metrics during both the pre-event and post-event periods, namely:
- The average number of new patient initiations on the drug of interest,
- The average number of continuing patients managed on a monthly or quarterly basis.
The retention rate in the post-event period serves as the monthly or quarterly decay rate estimates.
Step 3: HCP Archetype Creation (for Both Test and Control Groups): We then use a combination of sales, patient-based metrics (new or continuing patients), and promotional volume to create various HCP archetypes for the test and control groups.
Step 4: Overlay the Test Group’s Decay Rates Onto the Control Group’s HCPs: This step aims to find HCPs in the control group that mimic HCPs in the test group. We then overlay the retention rates calculated in step two onto similar control group HCPs.
- Each HCP in the control group will be matched with HCPs in the test group based on similarities such as location, specialty, patient characteristics, sales, and promotions in the pre-blackout period.
- Sometimes, a control group HCP may be matched with two or more test group HCPs. In those cases, the retention rate of those test HCPs can be averaged and used as the retention rate for the control HCP.
By completing steps one through four, we should have the retention rate or decay rate for the HCP pool for at least 12 months (assuming we have the retention rate estimates for the test group HCPs for 12 months). We can then move to step five.
Step 5: Projected Baseline Decay: Suppose the need is to have a long-term projection of how the baseline is expected to decay, not just limited to what is likely to happen in the next 12 months. In that case, we must base it on mathematical models that account for the decay rate (the retention rate calculated above) and estimate forward-looking sales curves. There could be various approaches to fit the retention rates into a mathematical equation, such as the Bass diffusion curve, exponential smoothing, etc. As an example, a simplified version of the baseline decay equation looks something like this:
Sales(t) = Sales (0) * exp (-r * t), where
Sales(t) is the sales at time t
Sales (0) is the initial sales at t=0
r is the decay rate (a positive constant). The higher the value of r, the faster the sales decay.
t is the time
Axtria’s Proof of Concept
Axtria’s advanced analytics team applied the above two approaches for a life sciences company to measure the baseline erosion of a drug in its mature lifecycle stage. Upon comparing the results, the HCP-level patient retention rate-based approach yielded a more organic erosion curve, which was more reasonable than the MMx model parameters-based method. The chart below shows that while the shape of the MMx model parameters curve is similar to the HCP-level patient retention rate approach, the decline in baseline erosion is much faster.
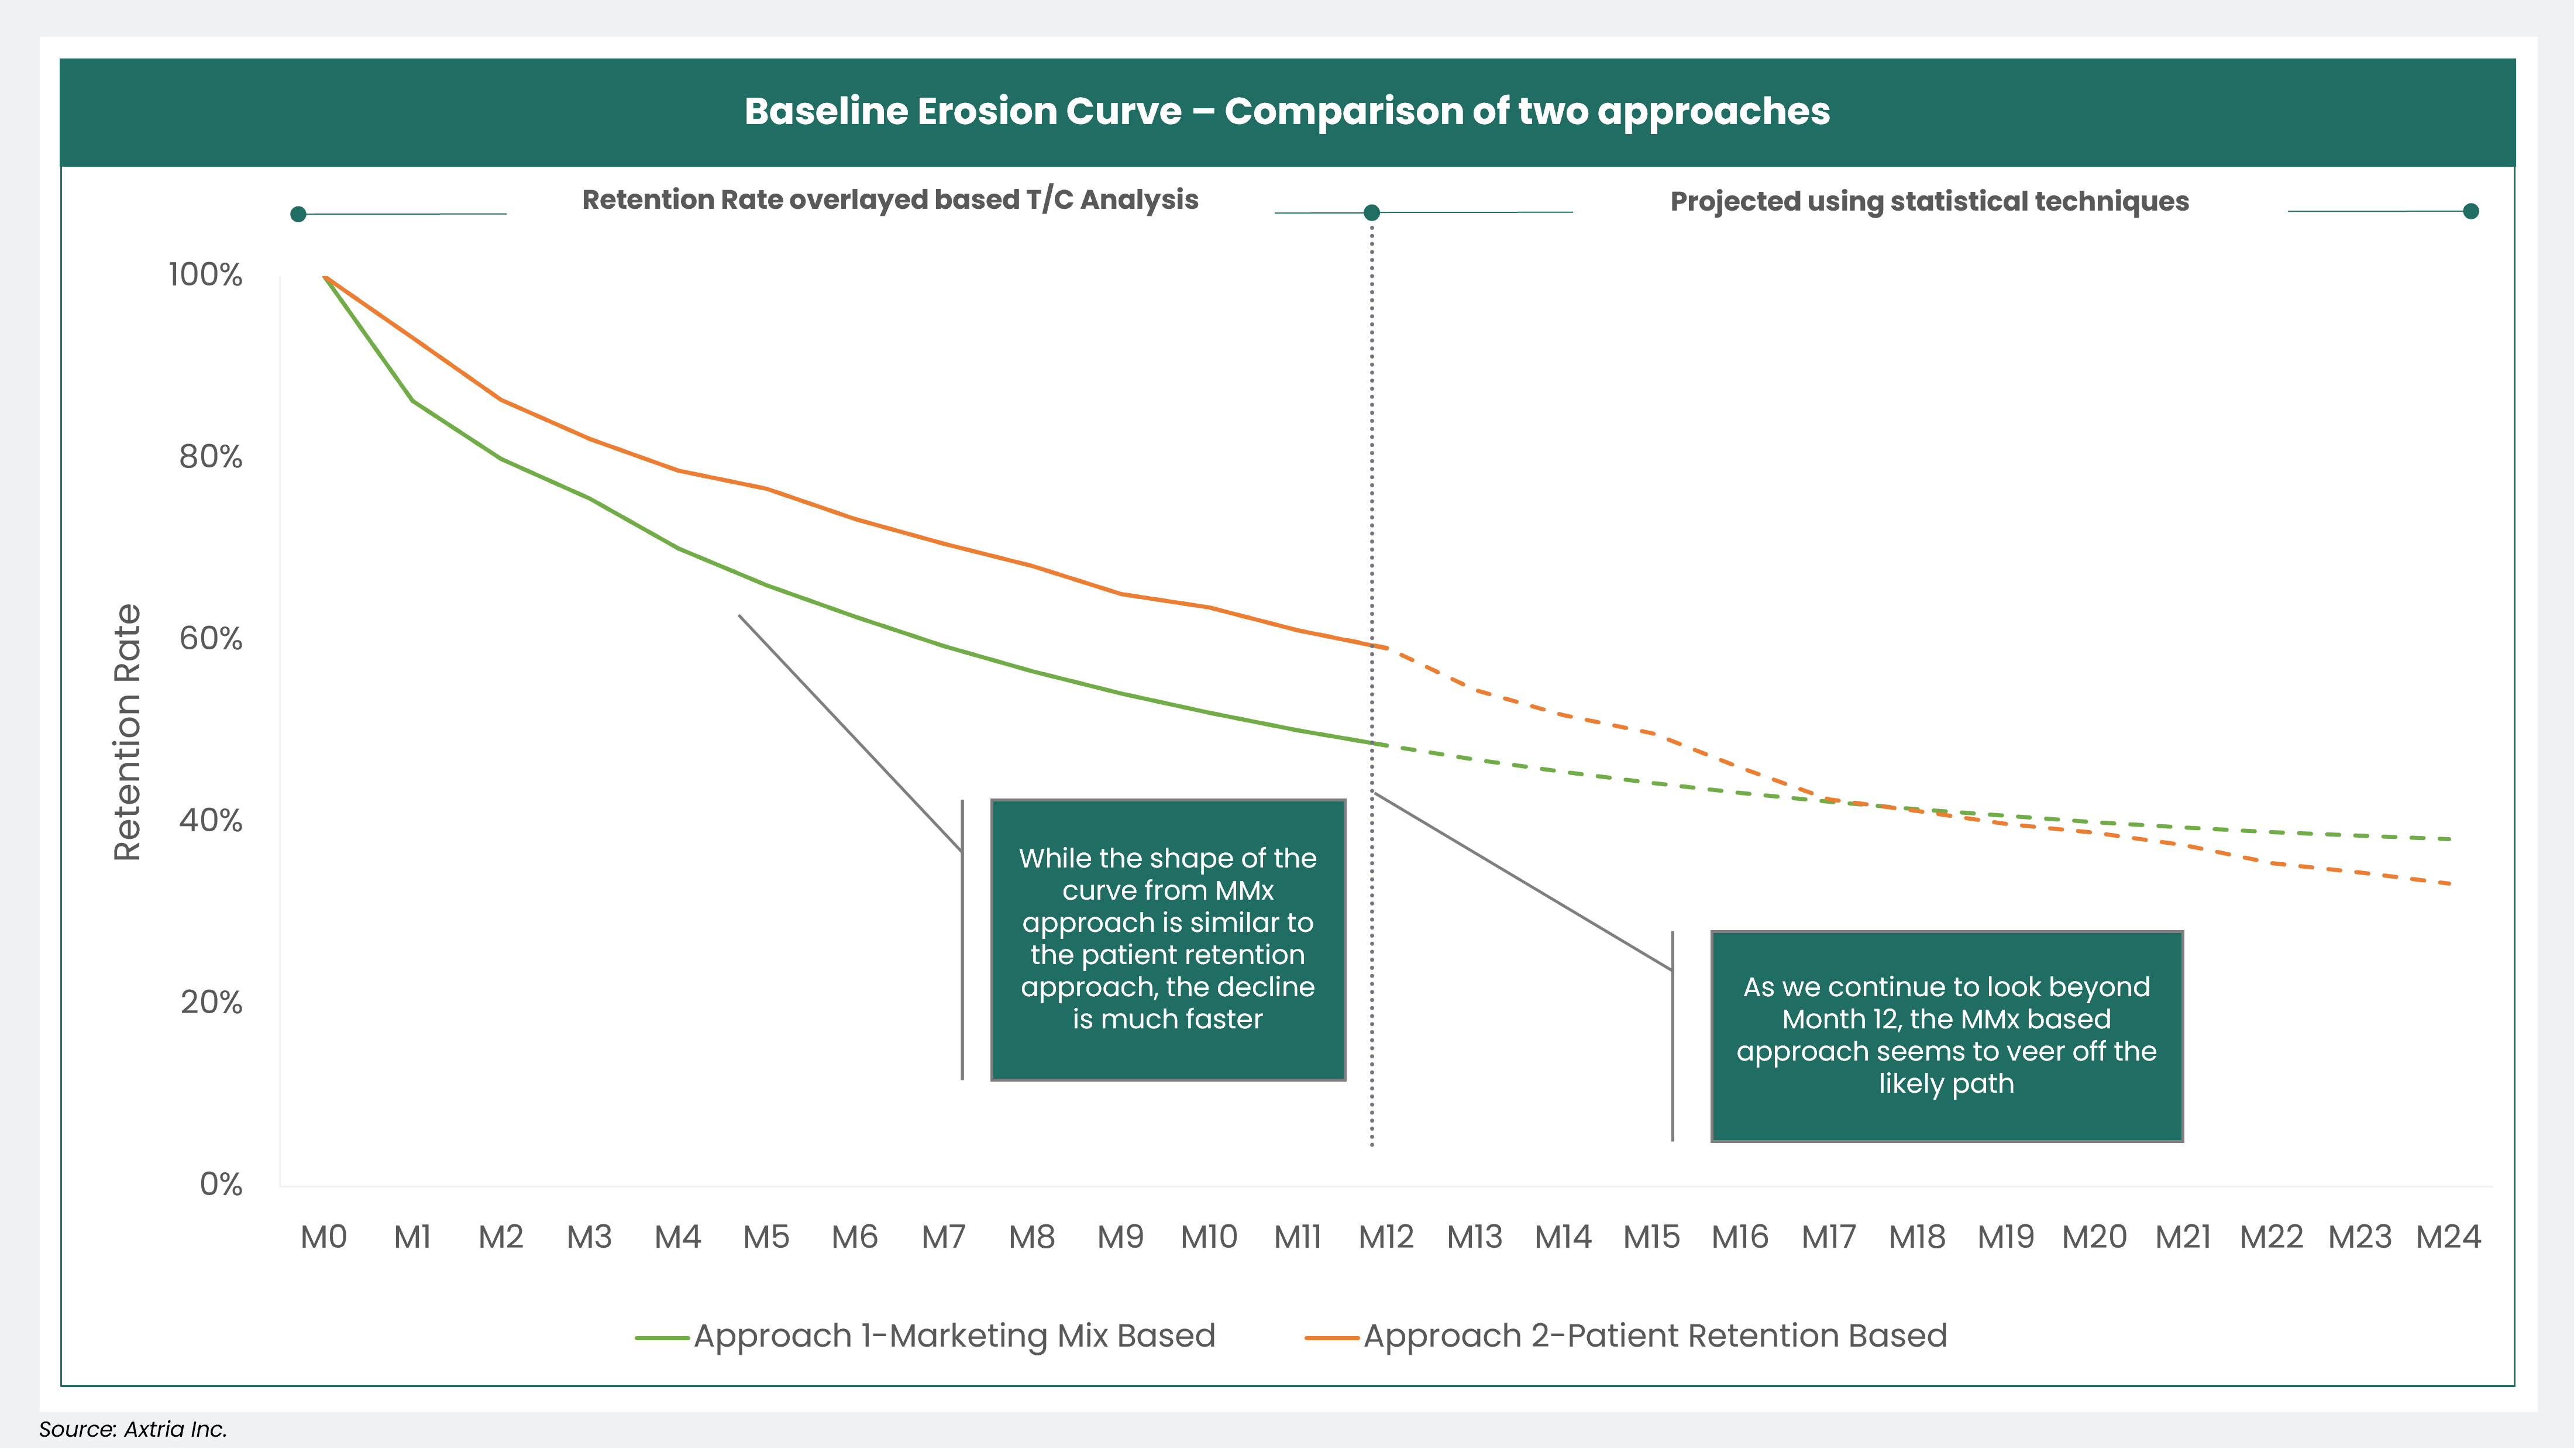
Figure 2: The Baseline Erosion Curve
Some caveats to consider:
- There is a risk of overestimating the decay in baseline sales. This occurs because the retention rate for the test group—which is overlaid onto similar HCPs in the control group—is calculated from HCPs who were taken off the target list. The HCPs could have been removed from the target list for a variety of reasons ranging from their higher affinity towards a competitor product to a tactical change on the marketing front. These HCPs are likely to have a quick decay in terms of the number of new and continuing patients.
- Retention rates calculated for the test HCPs and then overlaid onto control HCPs do not account for the impact that significant contracting changes can have on HCP writing behavior.
What Are the Parameters That Drive the Degree of Baseline Erosion?
- LOE of the drug: Whenever any medication loses its exclusivity after a defined period, it may have significant implications for the baseline erosion of that drug. The most immediate and significant impact of losing exclusivity is increased competition. Generic or biosimilar drug manufacturers can enter the market, offering equivalent or related products at a lower cost.
- Competitive activity: Even before LOE, increased competition in the market can erode the effectiveness of the existing marketing efforts. New entrants, aggressive marketing by competitors, or innovative strategies can divert customer attention and affect the market share.
- Market saturation: When a market is saturated with related products or services, it can be more challenging to stand out and keep market share, leading to baseline erosion. Customers may become less responsive to the marketing messages.
- Contracting and rebating arrangements: Changes in contracting and rebating arrangements can have a significant negative impact on a drug's baseline sales. It reduces market access through unfavorable formulary positioning for the drug, thereby impacting the market share.
- Clinical trial requirements: Regulatory authorities may impose additional clinical trial requirements for safety or efficacy, delaying the entry of generics or biosimilars, which can protect the original drug’s market position.
Conclusion
In the dynamic business world, baseline sales erosion is both a challenge and an opportunity. Recognizing and addressing the baseline sales erosion is vital as it challenges businesses to remain vigilant, innovative, and customer-centric. In this blog, we have explored the various facets of this phenomenon, from its causes to its impacts and how to measure its effects. This can help pharmaceutical companies make better-informed decisions on their marketing strategy.