Overview of Current Market-Mix Methodologies
For over 25 years, the pharmaceutical industry has relied on marketing-mix (MMx) analyses to measure the effectiveness of their promotional activity and to optimize marketing budgets [1]. A typical MMx study uses statistical methods to estimate the effect of independent variables such as promotional activity, prior month sales, and control variables (e.g., seasonality, market events, and market trend) on the dependent variable, which is typically a measure of sales (Rx, units, or revenue). Over the years, as the marketing landscape became more complex with the proliferation of digital channels, the MMx methodology evolved to account for complex interactions between various promotion types [2].
However, in all these analyses, the managed care dynamics are frequently assumed to be a constant. Although managed care does not directly impact how a sales rep influences a healthcare professional (HCP) to want to prescribe a specific product, it does impact whether the prescription happens or not. For the prescription to go through, the entire managed care ecosystem needs to work like a well-oiled machine to ensure that the patient gets timely and affordable access to the drug [3]. At the very least, that same machinery needs not to place an impossible-to-overcome barrier.
Managed Care Stakeholders Influencing Drug Prescriptions
For this blog, managed care refers to the organized ecosystem that aims to deliver high-quality and affordable healthcare services to patients. The stakeholders include pharma companies, healthcare providers, managed care organizations (MCOs, or payers), and Integrated Delivery Networks (IDNs). Figure 1 below depicts key interactions among these stakeholders that enable drug prescriptions.
Figure 1: Interactions Among Managed Care Stakeholders
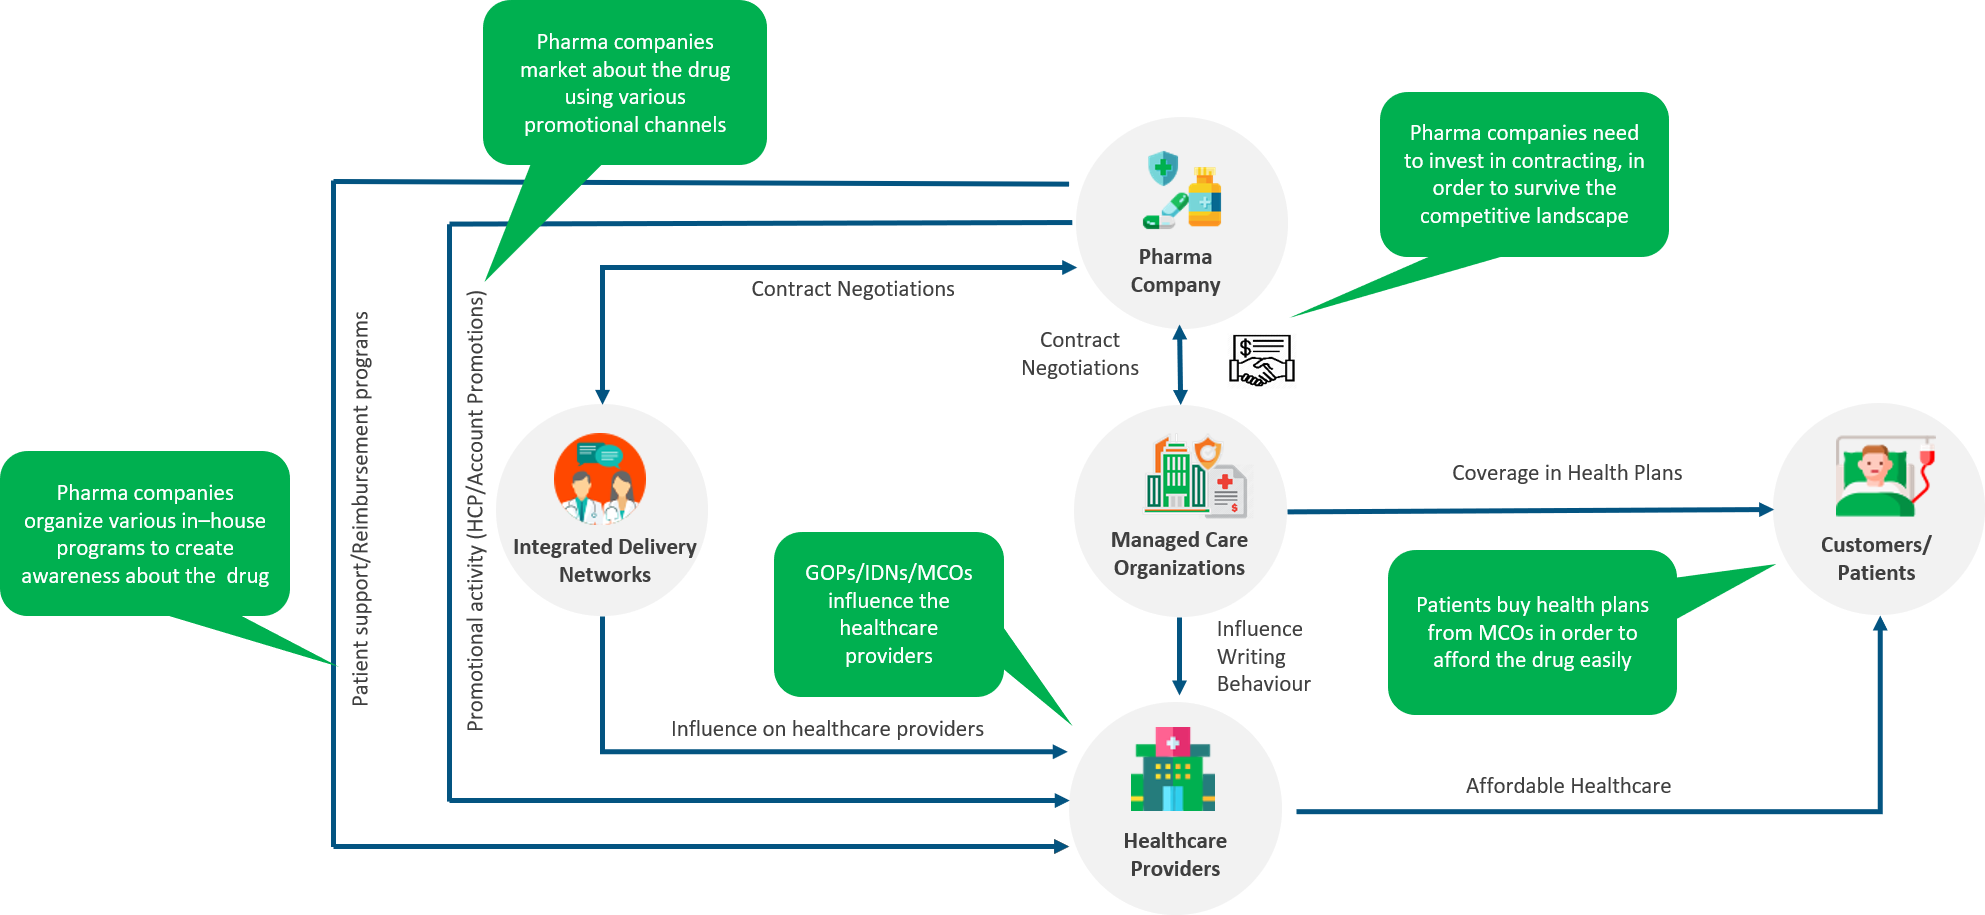
Source: Axtria Inc.
Pharma companies enter into contracts with MCOs, to ensure a competitive presence of their drug in the MCOs’ insurance plans. MCOs, in turn, influence the writing behavior of HCPs at hospitals with which they have an agreement to reimburse some or all the cost of the drug. A favorable contract also prompts HCPs to prescribe the drug since it makes the drug more affordable.
At the same time, healthcare providers are coalescing into healthcare ecosystems centered around IDNs to provide holistic care to patients [4]. The Affordable Care Act of 2010 was aimed to provide cost-effective healthcare to more people and thus prompted the shift from volume to value in healthcare delivery. As a result, IDNs emerged to offer a continuum of healthcare services and started promoting specific treatment protocols that (ideally) should demonstrate evidence of better patient outcomes. These IDNs can influence, even compel, in some circumstances, affiliated HCPs to follow these treatment protocols. Large IDNs have centralized control over HCPs through employment, common branding, and clinical integration through a common Electronic Health Record (EHR) system that is monitored to track patient outcomes and protocol adherence. The level of influence that an IDN enjoys over HCPs has an impact on their prescribing behavior.
The discussion above shows two strong factors that positively impact HCP prescribing behavior – favorable managed care contracts and a strong IDN control. These factors, in turn, make the job of drug promotion easier. Consider this – it is easier to convince a doctor to prescribe a drug and for the patient to receive it if it enjoys unrestricted access than if it needs prior authorization.
Learn More - A Market-Driven Model For Managed Markets Operations
Why do we Need to Account for Managed Care Dynamics While Measuring Promotion Effectiveness?
Managed care dynamics diverge across geographical areas and with time. A drug might have a more favorable formulary coverage in New York than in California. The IDNs in the Midwest might be more controlling than those on the East Coast. And these divergences cause promotion effectiveness to vary. Hence, in order to better measure the promotion effectiveness, it is important that these dynamics are accounted for in MMx models. This is because it would not be prudent to construct the promotion effectiveness variable to have the same parameters for different regions or different customers with different coverages and different IDN control levels. For example, both the maximum possible effect of rep calls on sales and the slope reaching that point, will be different for a geography with better insurance coverage than otherwise.
How to Measure Managed Care Variables for use in MMx Models
Having established the need to incorporate managed care dynamics in MMx models, we need to find a way to codify them. How do we measure the plan favorability? How do we measure the level of control exerted by an IDN?
At Axtria, we have deployed various analytical techniques to measure these dynamics.
Contract Plan Favorability
This can be quantified in terms of a plan favorability index/score, (i.e., a relative numeric representation of all the qualitative and quantitative characteristics of a plan for the brand). This score takes the following into account:
-
- Relative brand positioning: this measures the brand’s position relative to its competitors within plans. Plans, where brands have better copay/formulary status with respect to the competitors, will have higher scores. For example, the favorability index for a plan with formulary status as “Accepted” for a drug will be higher if the leading competitor is “Restricted” versus when the competitor is also “Accepted.”
- Absolute brand positioning: this combines formulary status and universal tier to create a score. The score changes positively with positive changes to the universal tier or formulary status. For example, the index for a plan with “Accepted” and “Tier 2” status will be higher than a plan with “Restricted” and “Tier3” status.
The favorability indices for all the plans for an HCP can be weighted by number of lives covered and then combined to arrive at a composite plan favorability index for an HCP. To make the analysis more robust, we can also introduce a temporal component to the index by calculating this index on a timely basis, say, once every six months, or on a rolling-period basis, if there is evidence of high volatility in the data.
IDN Control
IDN control can be inferred from various characteristics of the IDN:
-
- Percentage generic share: a higher percentage generic share indicates higher control since the IDN will try to drive the costs down through increased generic usage.
- Variance of brand share: Significant deviation of an HCP’s writing behavior from the average writing in their geography might indicate a strong influence of the IDN they are affiliated with.
- Physician affiliation: A singly affiliated physician is one who is affiliated to only one IDN. Similarly, a multi-affiliated physician is affiliated to more than one IDNs. Higher the percentage of singly affiliated physicians, the higher the control. In addition, the “nature” of the affiliation can be considered an employee relationship. IDN ownership of a practice will usually reflect higher control than if the HCP merely has admitting rights to an IDNs hospital.
An IDN can be considered high control based on any of the above specified control metrics. Therefore, a single index needs to be created which encompasses all the dimensions of control. Overall control for these IDNs is a combination of these metrics as a continuous variable. Since each metric is different, percentiles of individual metrics are obtained so that all the metrics are on a similar scale. Weightages for individual metrics are given as input, allowing the analyst to account for which factors are most important or most accurately measured. Overall control is a weighted average of each metric. The control metric calculated for each IDN can be assigned to the affiliated hospitals/HCPs to be used as a modeling metric. Like contract plan favorability, a temporal component can be added to the index by calculating this index on a timely basis, say, once every six months.
Both contract plan favorability index and IDN control index can be classified into a high-low or a high-medium-low flag (essentially, rendering the continuous variables into two- or three-part ordered categorical variables) if needed. This structure may lend simplicity to interpretation and use in MMx models.
![]() Learn More - Assessing Interaction Among Promotion Channels To Accurately Measure Marketing ROI?
Learn More - Assessing Interaction Among Promotion Channels To Accurately Measure Marketing ROI?
![]() Learn More - How Should A Marketing Mix Analysis Influence The Next-Best Actions?
Learn More - How Should A Marketing Mix Analysis Influence The Next-Best Actions?
How to Incorporate Managed Care Variables into MMx Models
The flags created above are meant to differentiate HCPs/accounts/geographies in terms of their managed care characteristics. These characteristics have a bearing on the promotion effect and hence on the construct/parameters of the promotion effectiveness variable. There are two fundamental ways of representing the effectiveness variable based on managed care characteristics:
- Segmentation
Consider the managed care flag (contract plan favorability and/or IDN control), having high-medium-low values at the HCP level, as one of the dimensions while segmenting the data. This will allow the modeler to build different response curves for HCPs with different managed care dynamics.
An advantage of this approach is that it allows measuring the effect of managed care on all the modeling variables. A downside is that the number of segments can increase significantly, potentially by a factor equal to the number of categories across all variables. - Interaction Variable
As established above, managed care dynamics have an impact on the HCP’s prescribing behavior and, in turn, on promotion effectiveness. These dynamics can determine the maximum impact a promotion can have(i.e., the slope of a promotion response structure). Therefore, instead of having a static slope, we can allow for it to “interact” with the managed care flags to ensure that HCPs in a “more favorable” managed care environment have a higher slope (i.e., higher effectiveness).
This approach allows the modeler the flexibility to choose which promotion variables need to “interact” with managed care flags based on business judgment without inflating the number of segments.
![]() Learn More - What Managed Care Analytics Means To Pharma Brand Success – Part 1
Learn More - What Managed Care Analytics Means To Pharma Brand Success – Part 1
Conclusion
Measuring promotion effectiveness in the backdrop of the managed care ecosystem will allow for better estimation and offer insights into how managed care dynamics play in enabling promotion channels to do their job. With the managed care ecosystem undergoing a change under the current COVID scenario, incorporating managed care dynamics into MMx models becomes even more relevant. Loss of jobs means fewer enrollees under commercial plans and more enrollees under Medicaid plans. Increased emphasis on telemedicine, home infusions, and self-administration rather than in-office infusions will likely affect formulary status changes [5]. Moreover, uncertainty over the future means that some of these changes are likely to be transient, although their evolution is uncertain [6]. This further underlines the need to adjust MMx approaches to account for managed care dynamics. These approaches can help pharmaceutical companies make better-informed decisions on their marketing strategy.
![]() Learn More - Axtria's Marketing Analytics Capabilities.
Learn More - Axtria's Marketing Analytics Capabilities.
References
- Masood I. Evolution of marketing techniques, adoption in pharmaceutical industry and related issues. Journal of Clinical and Diagnostic Research, published online December 2009, available at https://www.jcdr.net/article_fulltext.asp?id=609.
- Marketing mix modeling for a leading pharma company. Published online, available at https://www.quantzig.com/content/marketing-mix-modeling-pharma-company.
- Wood D. How MMX Should Address COVID Related Questions. Pharmaceutical Management Science Association 2020, May 2020.
- Decision Resource Group. Integrated Delivery Networks and their growing influence on regional healthcare in the US. Published online, available at https://decisionresourcesgroup.com/solutions/integrated-delivery-networks-and-their-growing-influence-on-regional-healthcare-in-the-us/.
- Nam D. Post COVID-19 implications for managed care pharmacy. The American Journal of Managed Care, published online 21 October 2020, available at https://www.ajmc.com/view/daniel-nam-on-post-covid-19-implications-for-managed-care-pharmacy.
- Motto M and Larson P. COVID-19 and its impact on market access (payers and organized providers). Intouch Solutions, published online 16 April 2020, available at https://www.intouchsol.com/blog/covid-19-and-its-impact-on-market-access-payers-and-organized-providers/