Opportunity
Few things are more exciting to an industry than the prospect that new data assets can be harnessed to drive true competitive advantage. Social media data refers to conversations posted in social media channels such as Facebook, Twitter, Instagram..etc. In 2015 were more than 1 billion posts and 735 million comments on Facebook, 150 million tweets on Twitter, and 2 million blog posts daily generating unprecedented amount of data. Social media data needs to be analyzed more carefully and summarized more thoughtfully before its value for Pharma marketing teams can be established.
There has been reasonable hope in the Pharmaceutical industry that social media data could be a major, new and relevant source of brand intelligence. At a minimum, social media data has the potential to be used to complement traditional data sources about brand intelligence such as ATUs, syndicated panel-based reports and the like, or even supplement them as this data is much more costly to obtain. It also has potential to be used for key opinion leader/influencer identification, campaign evaluation..etc . Perhaps the most interesting, however, is in its use as an early warning indicator of brand performance (particularly during early launch) and inform critical course corrective actions. This is what we addressed empirically and report on in this blog.
Design and Results
Axtria explored the “social media brand equity-brand performance” relationship for 2 Oncology products and specialty product at different points in the lifecycle using social media data from July to December 2015. Brand social equity was defined as the product of the share of voice (SOV) for a product among all conversations for brands in its market, and net brand sentiment (NBS). Net brand sentiment (NBS) is defined as the weighted average of the percentage of conversations classified as positive, neutral and negative. Note that we would anticipate using a more tailored, sophisticated algorithm for measuring social brand equity for each client.
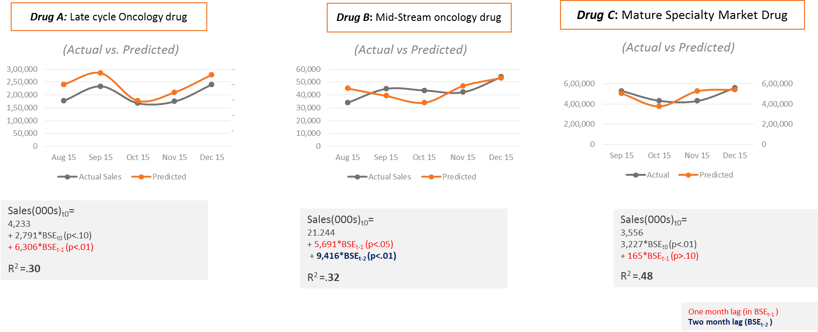
Models were developed using lags of brand social equity regressed on monthly brand sales at the regional level. Per below we found that social-media based brand social equity moved largely in tandem with sales for the three brands.

Next we found that brand social equity alone provides solid predictive power for sales for each of the study products with R2s in the range of .30 to .48. Note that BSE was a stronger leading indicator for Brand B (at mid-stream in its launch) with a two month lag in BSE highly predictive of future sales.

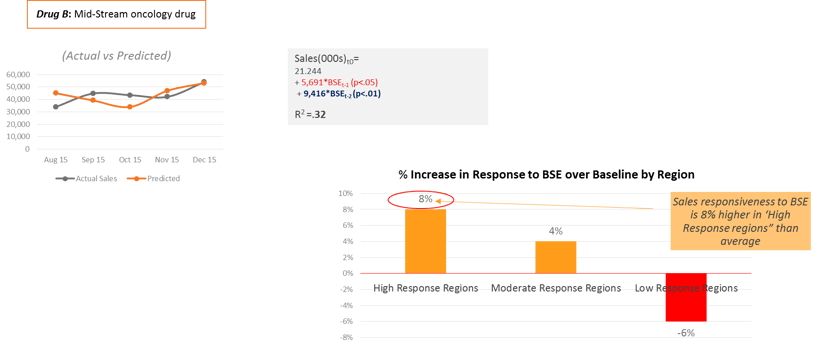
Finally we found that the BSE-brand performance relationship differed notably by region per below. This may suggest greater potential upside from managing to BSE in some regions than others

Conclusions
While we did not have access to the full range of information traditionally incorporated into response models for this assessment, our sense is that these results quite are encouraging.
The relationship between ‘social media brand equity-brand performance’ was fairly robust with evidence suggesting that BSE is at least a moderately strong early indicator of brand performance for the brands studied. We would encourage brands team to explore the value of social media data based on brand equity measurement and a structured modeling approach.


